Kllyroo

End-to-End Monitoring for Servers

A platform to help DevOps and IT teams see what's happening across their systems. It tracks performance, issues, and logs to keep everything running smoothly.

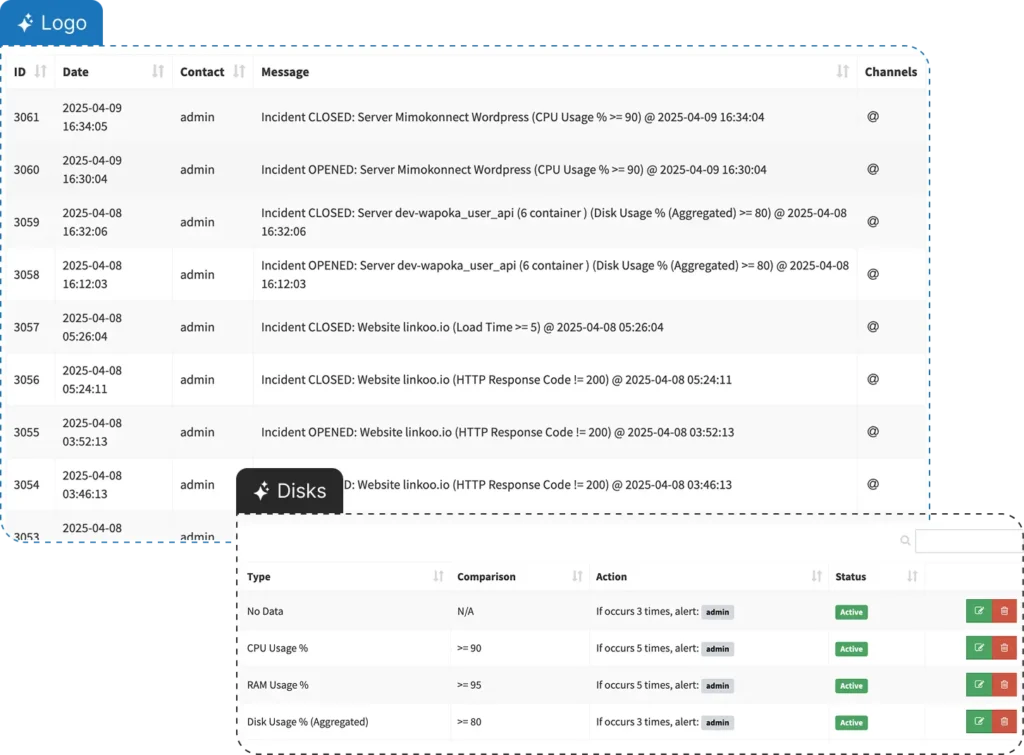
Log & Alert Monitoring

Monitor and trouble shoot from various Source

Error & Security Monitoring

NetFlow analysis, monitoring, and bandwidth utilization for your entire IT infrastructure.

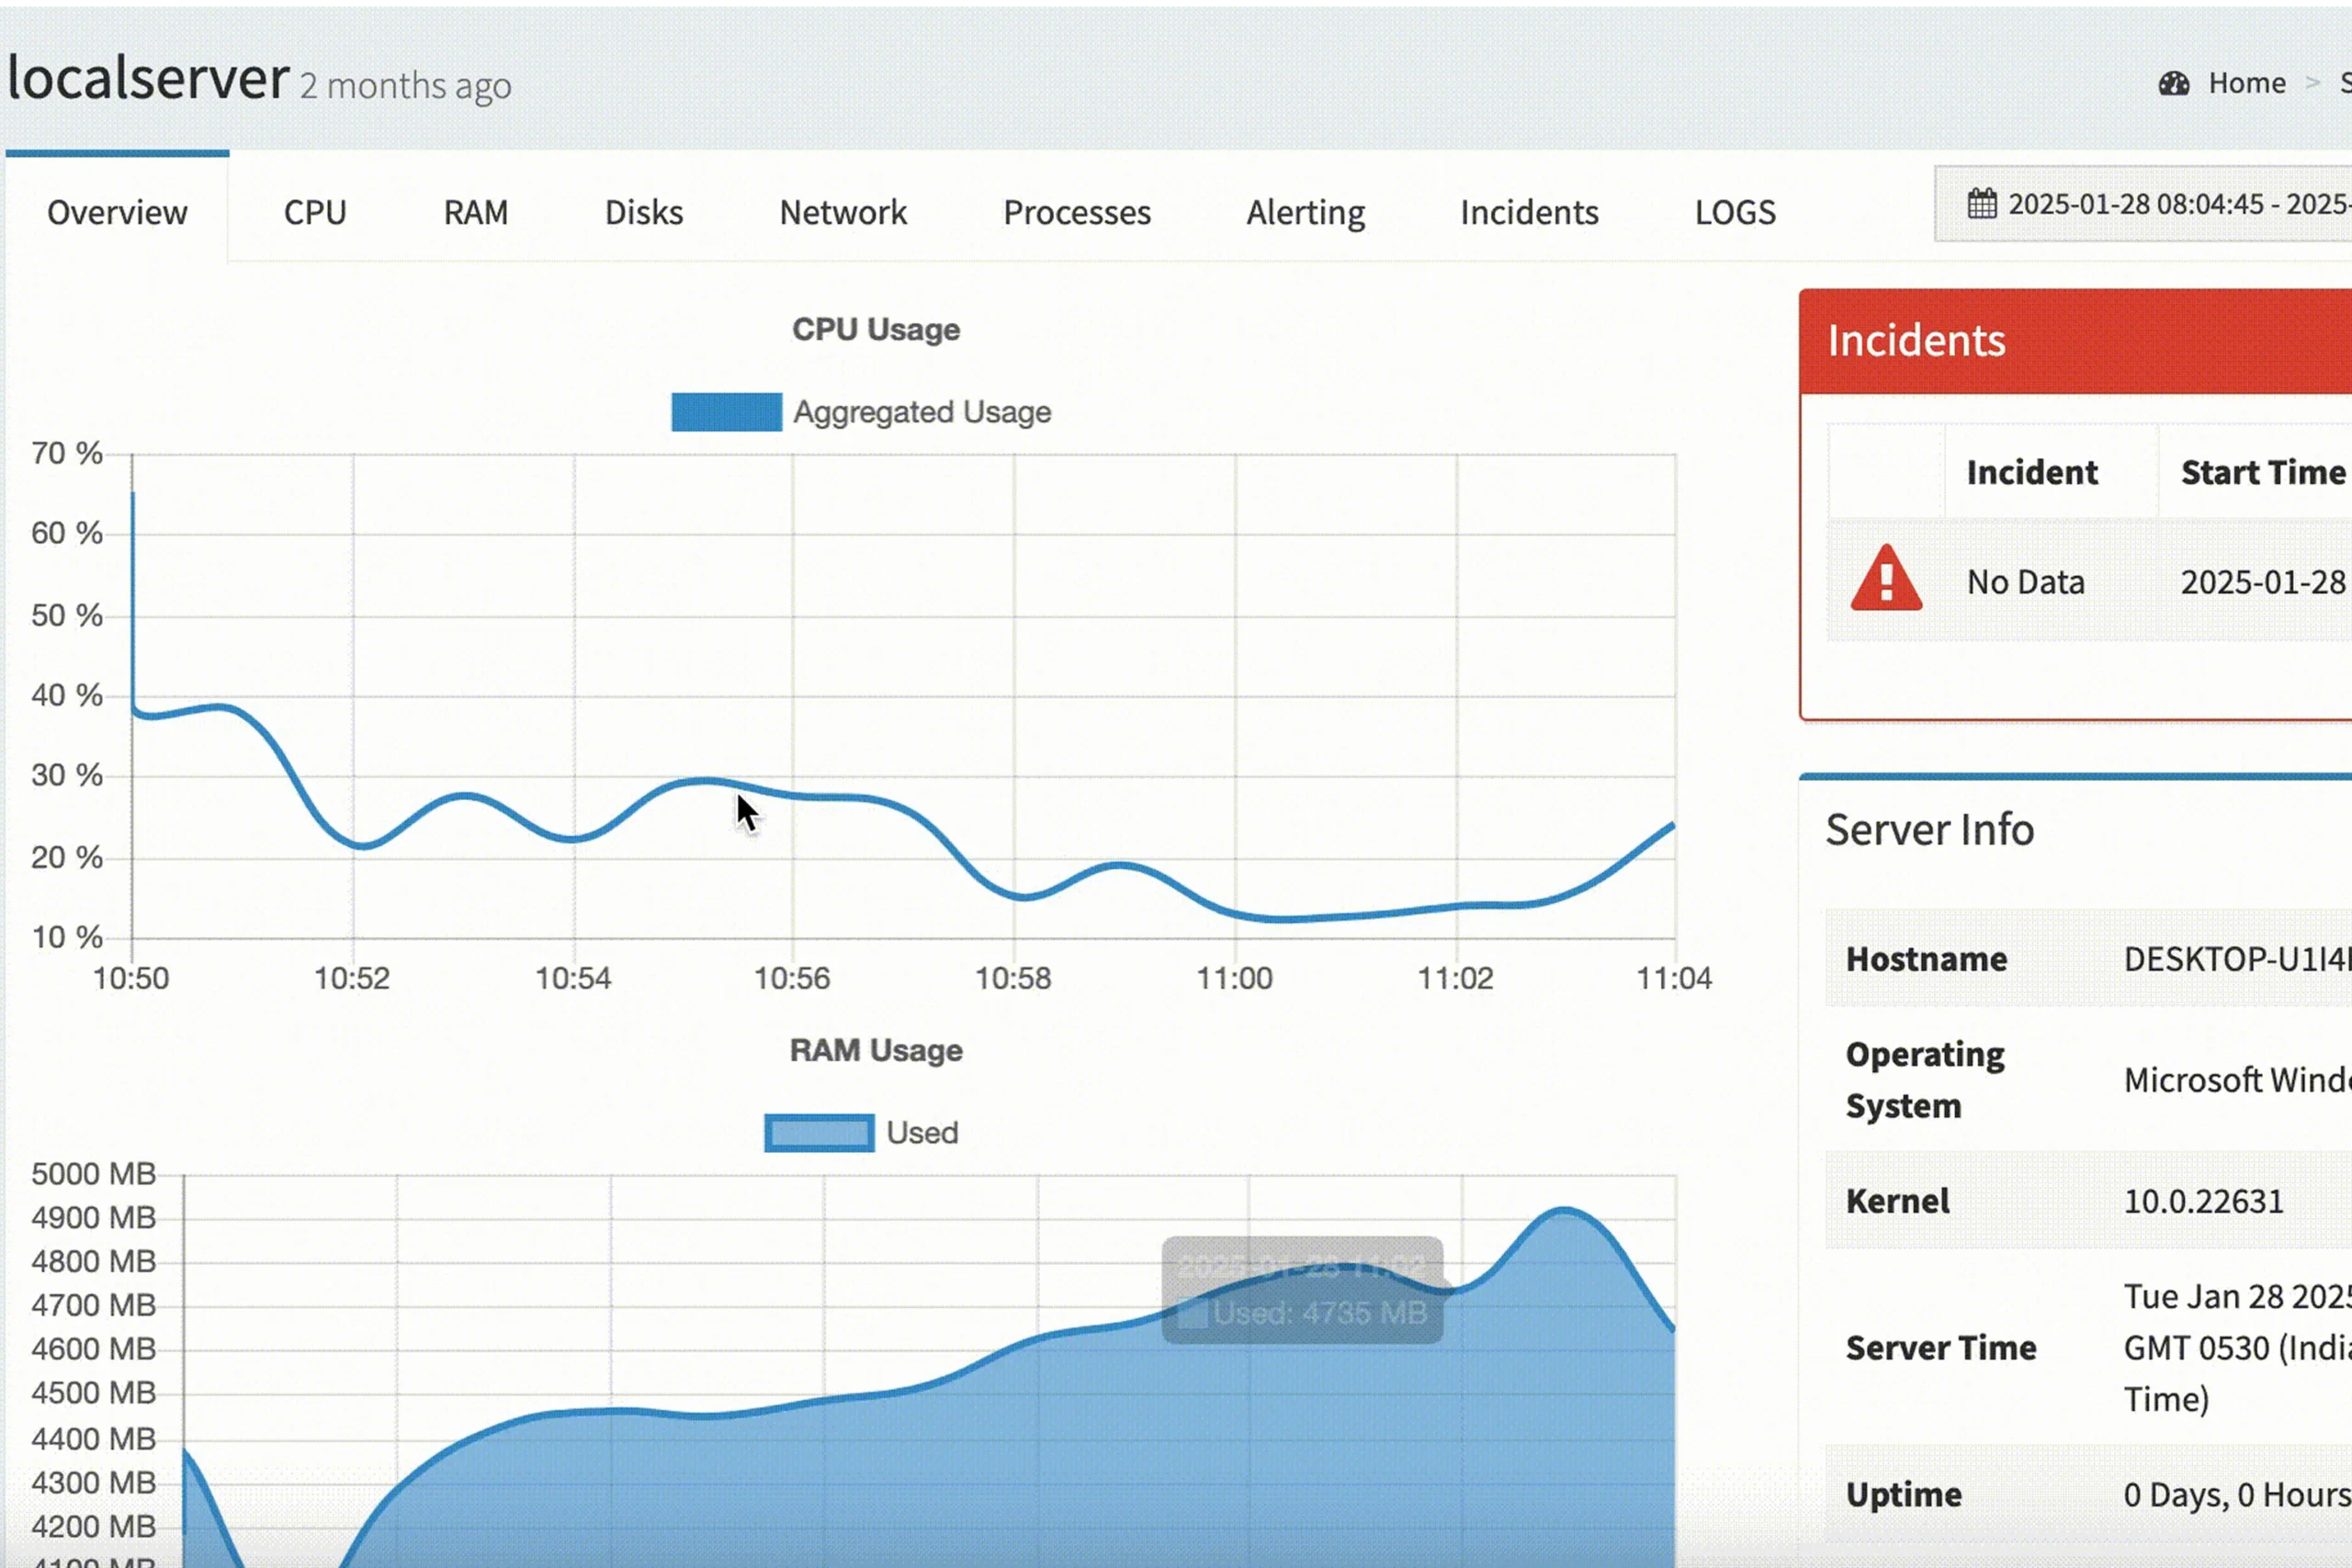
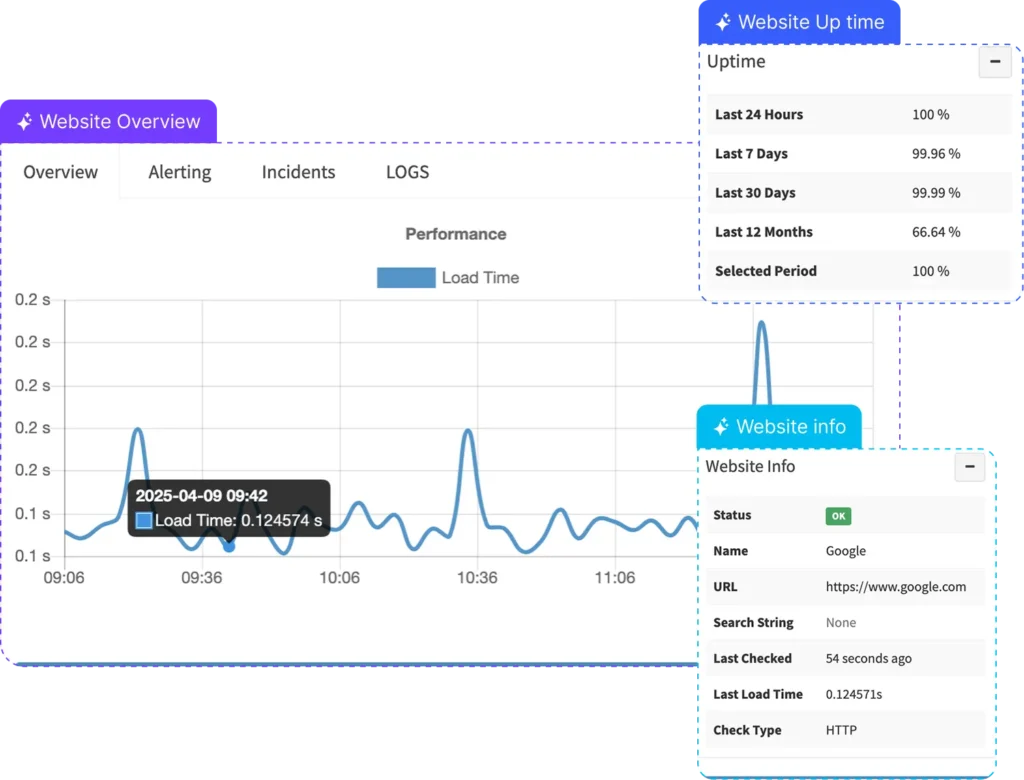
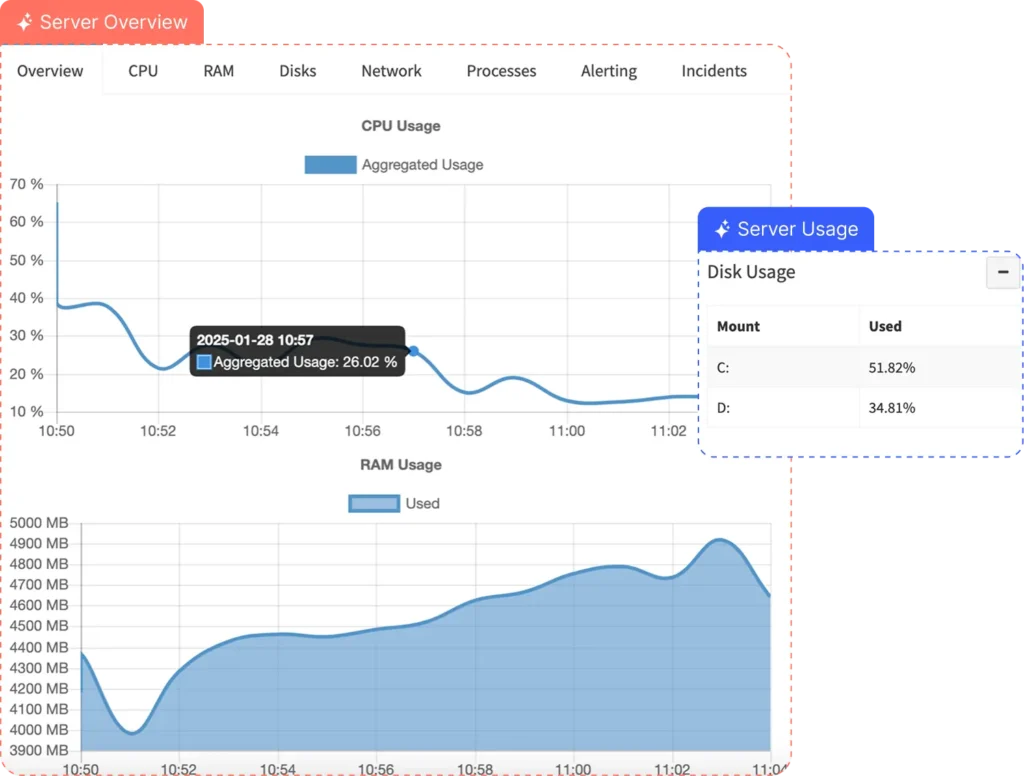
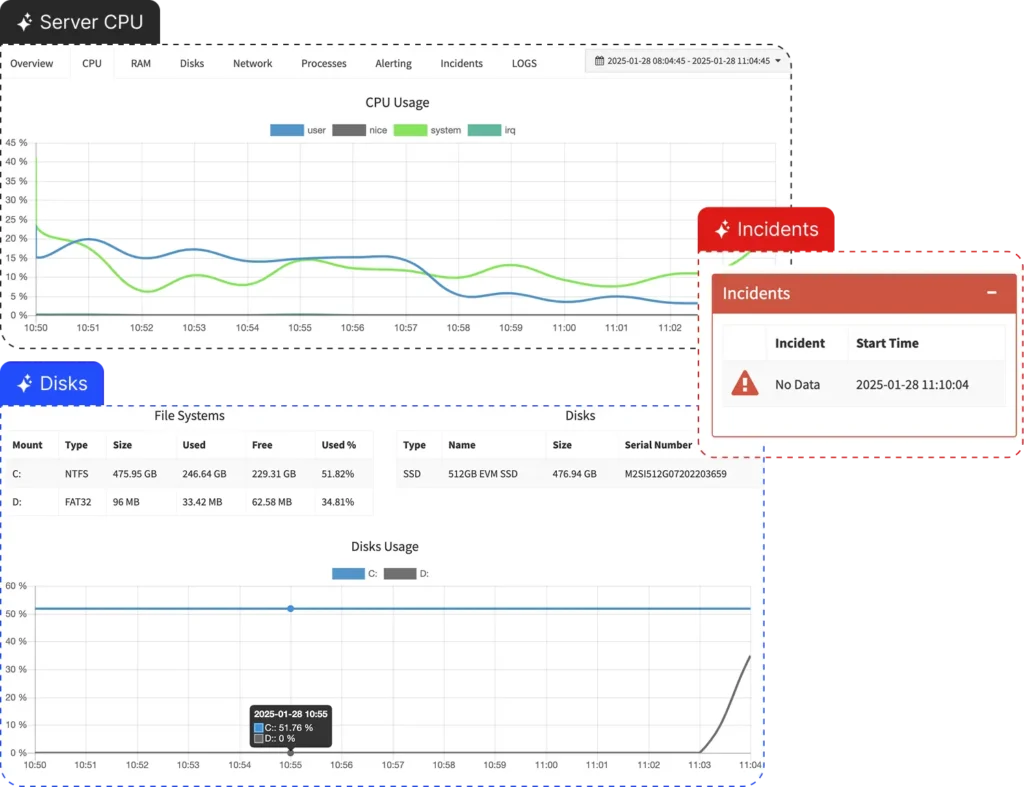
Performance Tracking & Analytics

Analyze your log data, your way. Search, query, and filter to achieve insight-driven decision-making at scale.

A tailor-made Monitoring Solution for your multiple server

Work more efficiently with Kllyroo Server and be in control with ease of your environment.

Websites

NetFlow analysis, monitoring, and bandwidth utilization for your entire IT infrastructure.

Cloud Instances

Monitor, troubleshoot, and proactively alert on your infrastructure in a streamlined environment.

Alert Monitor

Analyze your log data, your way. Search, query, and filter to achieve insight-driven decision-making at scale.

Servers

Visualize multiple Instances and solutions all on one screen

Our active Paying Customers

What our platform do ?

Uptime Monitoring

Cloud Monitoring

Resource Monitoring

Error Monitoring

Auto Scaling Metrics

System Metrics

Logs Monitoring

Alert Monitoring

Benefits of using KLLYROO Portal

Uptime Monitoring

Continuously monitor the availability and response time of your websites from various locations.

Performance Monitoring

Track website performance metrics such as page load time, server response time, and resource utilization.

Error Monitoring

Monitor for HTTP errors, broken links, and other issues affecting the user experience.

Security Monitoring

Implement web application firewalls (WAFs) and perform regular security scans to detect vulnerabilities and malware.

Cloud Provider Monitoring Tools

We offer you the cloud scope to monitor for all the instance at the same time.

Key Metrics to Monitor

Tracks performance metrics like CPU, memory, disk I/O, and network traffic, along with instance health such as status, uptime, and availability.

Logging and Event Management

Collecting all the instance logs to Verify the user useage.

Metrics to Monitor

Tracks performance metrics like CPU, memory, disk I/O, and network traffic, along with instance health such as status, uptime, and availability.

Log Management

Monitor logs for errors, warnings, and security events to proactively address issues.

Compliance and Reporting

Ensure monitoring practices align with regulatory requirements and industry standards. Generate reports and audits to demonstrate compliance and track performance metrics over time.

Configure Alert Rules

Set up alert rules based on predefined thresholds or conditions. Threshold-based alerts: Trigger when a metric exceeds or falls below a specified threshold (e.g., CPU > 90%).

Anomaly detection

Identify unusual patterns or deviations from normal behavior. Correlation alerts: Combine multiple metrics to detect complex issues (e.g., high CPU and low memory simultaneously).

Notification Channels

Configure notification channels to deliver alerts to relevant stakeholders: Email: Direct notifications to email addresses. SMS: Send text messages for critical alerts.

What our Clients Say

Peter Belgium

Nemo enim ipsam volupt atem quia voluptas sit Nemo enim ipsam volupt atem quia voluptas sit

Peter Belgium

Nemo enim ipsam volupt atem quia voluptas sit Nemo enim ipsam volupt atem quia voluptas sit

Peter Belgium

Nemo enim ipsam volupt atem quia voluptas sit Nemo enim ipsam volupt atem quia voluptas sit

Peter Belgium

Nemo enim ipsam volupt atem quia voluptas sit Nemo enim ipsam volupt atem quia voluptas sit

Best Plans and Pricing for Business

Free Plan

$0/month

Monthly reviews along with tracking of Information

Features

Starter Plan

$10/month

Monthly reviews along with tracking of Information

Features

Professional Plan

$10/month

Monthly reviews along with tracking of Information

Features

Scroll to Top